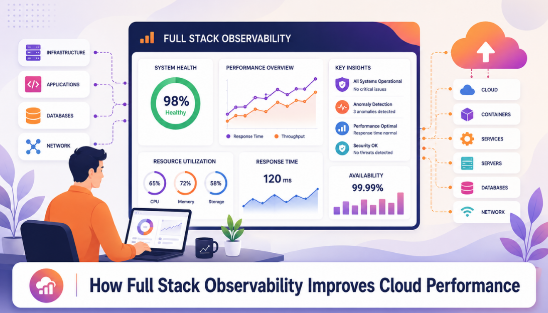
Cloud environments now stretch across multiple providers, containers and microservices, and a single transaction can pass through dozens of components before it reaches a user. When something slows down or breaks, working out which layer is responsible takes time most businesses cannot spare. Full stack observability gives engineering and security teams a way to see what is happening inside that sprawl instead of reading isolated alerts after the fact.
A recent industry survey put the median cost of a high impact outage at around two million dollars an hour, with organisations running mature observability programmes cutting that figure substantially through faster detection. This blog looks at how organisations are applying full stack observability to improve cloud performance, shorten downtime and keep distributed systems accountable as they scale.
What Full Stack Observability Actually Covers
Traditional monitoring tells a team whether a system is up or down. Full stack observability goes further by correlating logs, metrics and traces across the application layer, the infrastructure layer and the end user experience layer, so teams can see why a system is behaving the way it is.
That correlation matters more as architectures spread across microservices and multi-cloud setups. A request might touch a frontend service, three backend APIs and a managed database before it completes, and a slowdown anywhere along that path needs to be traceable back to its source within minutes, not hours.
Why Cloud Performance Depends on It
Cloud downtime is rarely caused by a single dramatic failure. Configuration errors, network or DNS issues and routine deployment changes account for the bulk of recorded outages, and the average cost of each minute of downtime has climbed sharply over recent years. Organisations with end-to-end visibility into their stack consistently report markedly lower downtime and faster mean time to resolution than those relying on fragmented monitoring tools.
Engineers without that visibility often spend a disproportionate share of their working hours on break-fix tasks rather than building features, which slows delivery well beyond the immediate incident. Full stack observability reduces that drag by surfacing the affected component early, before customer complaints or ticket queues become the first signal of trouble.
Where Observability Adds Value Across Teams
The benefit of full stack observability is not confined to the operations desk. Security, engineering and compliance functions each draw on the same correlated telemetry for different purposes, and the six areas below are where that value shows up most consistently in practice.
- Faster Detection: Correlated logs and traces flag anomalies before they escalate into customer-facing incidents.
- Root Cause Mapping: Distributed tracing follows a request across every service it touches, narrowing the search for the actual fault.
- Capacity Planning: Historical telemetry shows where infrastructure is under strain well before it affects performance.
- Compliance Reporting: Continuous monitoring data supports audit trails without manual log collection exercises.
- Cost Optimisation: Visibility into resource usage highlights overprovisioned services and idle capacity.
- Cross Team Visibility: A shared dashboard removes the back and forth between development, infrastructure and security teams during an incident.
Embedding Observability into the Development Lifecycle
A full stack observability programme works best when it is built into how software gets shipped, not bolted on once something has already gone wrong.
Instrumentation at Build Time
Instrumenting services as they are built means telemetry is available from the first deployment rather than retrofitted later. Each release carries its own tracing and logging baseline, which makes it far easier to compare performance before and after a change goes live.
Continuous Monitoring After Deployment
A build-time snapshot only captures one moment. Production behaviour shifts as load patterns change, so observability tools need to keep comparing live telemetry against expected baselines and flag drift as it happens, not days later during a postmortem.
Full Stack Observability and Business Continuity in India
Operational resilience expectations from Indian regulators have tightened in recent years. The RBI’s guidance on IT governance and business continuity expects regulated entities to demonstrate continuous monitoring of critical systems, and SEBI’s Cyber Security and Cyber Resilience Framework places similar weight on real-time visibility for market infrastructure institutions. CERT-In’s advisories on incident reporting timelines add further pressure to detect and document issues quickly.
For organisations operating regulated infrastructure, observability is not only an engineering convenience. It is increasingly the mechanism that makes timely incident reporting and audit-ready documentation possible in the first place.
Conclusion
Cloud performance and uptime now sit at the centre of how customers judge a business, and the gap between a five-minute fix and a five-hour outage usually comes down to how much visibility a team has into its own stack. Observability closes that gap by connecting logs, metrics and traces into one accountable view across every layer, from infrastructure to the end user.
CyberNX can help you build that visibility through its full stack observability services, designed to monitor your environment around the clock and correlate signals before they become incidents. If your organisation is looking to reduce downtime and bring every layer of its cloud stack under one view, connect with CyberNX’s experts.